Difference between revisions of "Beagle USB 12 Protocol Analyzer - Test"
EPelanovic (talk | contribs) |
EPelanovic (talk | contribs) |
||
| Line 39: | Line 39: | ||
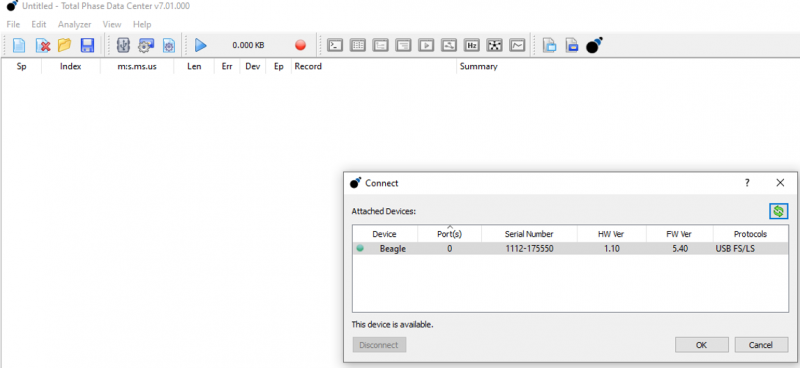
To capture traffic, click in the top toolbar at “Analyzer” and then on “Connect to Analyzer”. Confirm that the correct device is selected and click “OK”. | To capture traffic, click in the top toolbar at “Analyzer” and then on “Connect to Analyzer”. Confirm that the correct device is selected and click “OK”. | ||
[[File:Connect to Analyzer.png|800px|thumb| | [[File:Connect to Analyzer.png|800px|thumb|none|]] | ||
You can then connect the USB target device (for example a mouse) to the analyzer. After clicking on the play-button, we should then see all the packet data in real-time. | You can then connect the USB target device (for example a mouse) to the analyzer. After clicking on the play-button, we should then see all the packet data in real-time. | ||
[[File:Data Center Capture 1.png|800px|thumb| | [[File:Data Center Capture 1.png|800px|thumb|none|]] | ||
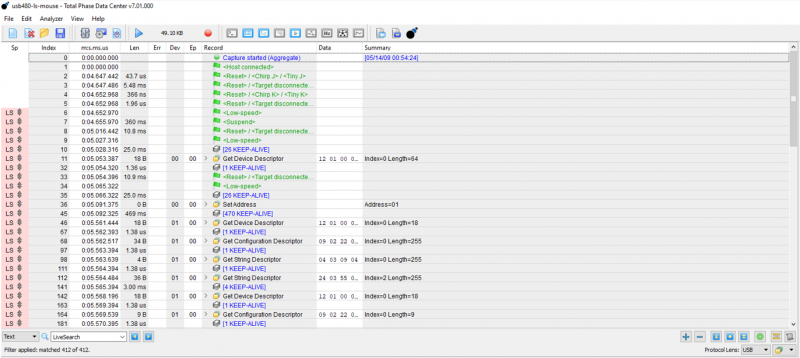
We can see that some interesting parameters like speed, timestamp, endpoint address and the actual data were captured. The captured data has been decoded into human readable messages. | We can see that some interesting parameters like speed, timestamp, endpoint address and the actual data were captured. The captured data has been decoded into human readable messages. | ||
| Line 49: | Line 49: | ||
We can double-click on any packet to see the low-level data and the corresponding details, which are shown in hexadecimal and ASCII. A mouse click is symbolized by a field named “Btns=[1]”. | We can double-click on any packet to see the low-level data and the corresponding details, which are shown in hexadecimal and ASCII. A mouse click is symbolized by a field named “Btns=[1]”. | ||
[[File:Data Center Capture 2.png|800px|thumb| | [[File:Data Center Capture 2.png|800px|thumb|none|]] | ||
It should be now possible to click on the bottom of the Navigator at “LiveFilter” to filter for those events. This should be possible by entering “btns=[1]” in the text field. Apply the filter and all “click”-mouse events are shown. This should be possible for every kind of patterns, endpoint addresses, and more. | It should be now possible to click on the bottom of the Navigator at “LiveFilter” to filter for those events. This should be possible by entering “btns=[1]” in the text field. Apply the filter and all “click”-mouse events are shown. This should be possible for every kind of patterns, endpoint addresses, and more. | ||
[[File:Data Center Capture 3.png|800px|thumb| | [[File:Data Center Capture 3.png|800px|thumb|none|]] | ||
By turning off scrolling and disabling the filter, we can see all the data that occurred before and after the events. | By turning off scrolling and disabling the filter, we can see all the data that occurred before and after the events. | ||
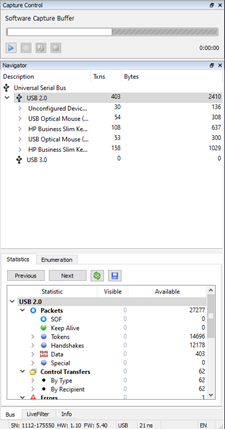
You can also connect a USB hub to the analyzer and plug in multiple USB devices. All devices with their assigned addresses will be shown under the navigator in the Data Center software. | You can also connect a USB hub to the analyzer and plug in multiple USB devices. All devices with their assigned addresses will be shown under the navigator in the Data Center software. | ||
[[File:Data Center Capture 4.png|800px|thumb| | [[File:Data Center Capture 4.png|800px|thumb|none|]] | ||
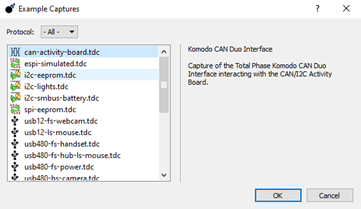
You can also find a lot of already captured examples under “Help”, “Examples”: | You can also find a lot of already captured examples under “Help”, “Examples”: | ||
[[File:Data Center Example Captures.png|800px|thumb| | [[File:Data Center Example Captures.png|800px|thumb|none|]] | ||
The protocol analyzer can therefore be very helpful for debugging errors or for forensic analysis, for example. | The protocol analyzer can therefore be very helpful for debugging errors or for forensic analysis, for example. | ||
Revision as of 15:23, 28 June 2022
Summary
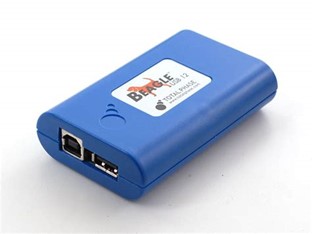
The Beagle USB 12 Protocol Analyzer is a nice tool to setup it quick and ease and allows engineers to debug problems quickly. You can capture, display and filter high-, full- and low-speed USB traffic in real time.
In the front of the analyzer there are the target host and target device ports. They act as a passthrough to connect the target device to the host computer.
Requirements
To be able to monitor the USB traffic you will need a software that captures and displays USB, USB Type-C Power Delivery, I2C, SPI, eSPI and CAN bus data through the Beagle. To download it from the Totalphase website you will need to create an account. This does not come with any subscription or cost factor. You can Download the Data Center Software for following architectures:
- Windows
- Linux
- MacOS
If you are using a Windows or a Linux host, it is also important to download the appropriate drivers since without them Windows will not recognize the analyzer:
MacOS do not require any driver. For more details like, key features, technical specifications or software requirements follow this link.
Description
With the type B USB cable connect the target host port at the front of the analyzer with your PCs USB port type A. The analyzis port at the backside of the analyzer is connected with another type B USB connector to your PCs USB port type A. Lastly you can then plug in your target device into the USB port type A of the analyzer.
Hands-On
To capture traffic, click in the top toolbar at “Analyzer” and then on “Connect to Analyzer”. Confirm that the correct device is selected and click “OK”.
You can then connect the USB target device (for example a mouse) to the analyzer. After clicking on the play-button, we should then see all the packet data in real-time.
We can see that some interesting parameters like speed, timestamp, endpoint address and the actual data were captured. The captured data has been decoded into human readable messages. At the beginning we can see the handshake between the computer and the connected device. We can double-click on any packet to see the low-level data and the corresponding details, which are shown in hexadecimal and ASCII. A mouse click is symbolized by a field named “Btns=[1]”.
It should be now possible to click on the bottom of the Navigator at “LiveFilter” to filter for those events. This should be possible by entering “btns=[1]” in the text field. Apply the filter and all “click”-mouse events are shown. This should be possible for every kind of patterns, endpoint addresses, and more.
By turning off scrolling and disabling the filter, we can see all the data that occurred before and after the events. You can also connect a USB hub to the analyzer and plug in multiple USB devices. All devices with their assigned addresses will be shown under the navigator in the Data Center software.
You can also find a lot of already captured examples under “Help”, “Examples”:
The protocol analyzer can therefore be very helpful for debugging errors or for forensic analysis, for example.
