Difference between revisions of "Valgrind"
VHorvathova (talk | contribs) |
VHorvathova (talk | contribs) |
||
| Line 165: | Line 165: | ||
* Valgrind checks programs dynamically during execution | * Valgrind checks programs dynamically during execution | ||
* Does not report errors if no runtime error occurs for certain input values | * Does not report errors if no runtime error occurs for certain input values (even if the program contains errors) | ||
** Faulty memory accesses or memory leaks | ** Faulty memory accesses or memory leaks | ||
* No bounds checking on static arrays (allocated on the stack) | * No bounds checking on static arrays (allocated on the stack) | ||
* No static stack/buffer/integer overflows/underflows | * No static stack/buffer/integer overflows/underflows | ||
* if you declare an array in a method, Valgrind does not warn about it | * if you declare an array in a method, Valgrind does not warn about it | ||
== References == | == References == | ||
Latest revision as of 13:46, 28 January 2023
What is Valgrind?
Valgrind is an instrumentation framework for building dynamic analysis tools. There are Valgrind tools that can automatically detect many memory management and threading bugs, and profile your programs in detail. You can also use Valgrind to build new tools.
Valgrind executes a program 20-30 times slower and performs dynamic code analysis.
Tools
The Valgrind distribution currently includes seven production-quality tools:
- Memcheck
- Cachegrind
- Callgrind
- Massif
- Helgrind
- DRD
- DHAT
Memcheck
Memcheck detects memory-management problems and is aimed primarily at C and C++ programs. When a program is run under Memcheck's supervision, all reads and writes of memory are checked, and calls to malloc/new/free/delete are intercepted. As a result, Memcheck can detect if your program:
- Accesses memory it shouldn't
- areas not yet allocated
- areas that have been freed
- areas past the end of heap blocks
- inaccessible areas of the stack
- Uses uninitialized values in dangerous ways.
- Leaks memory.
- Does bad frees of heap blocks (double frees, mismatched frees).
- Passes overlapping source and destination memory blocks to memcpy() and related functions.
Memcheck reports these errors as soon as they occur, giving the source line number at which it occurred, and also a stack trace of the functions called to reach that line. Memcheck tracks addressability at the byte-level, and initialization of values at the bit-level. As a result, it can detect the use of single uninitialized bits, and does not report spurious errors on bitfield operations. Memcheck runs programs about 10--30x slower than normal.
Following examples have been testen on a Kali Linux 22.04 system.
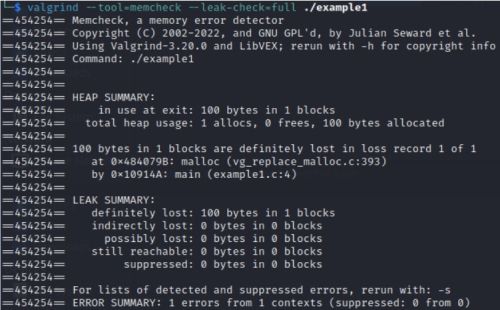
Memory Leak
   #include <stdlib.h>
   int main()
   {
       char *x = malloc(100);
       return 0;
   }
Compile via:
sudo gcc -g example1.c -o example1
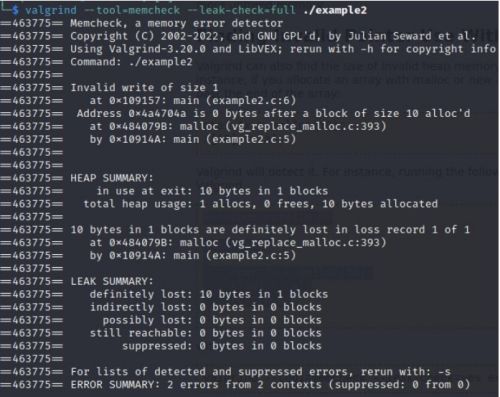
Invalid Pointer
   #include <stdlib.h>
   int main()
   {
       char *x = malloc(10);
       x[10] = 'a';
       return 0;
   }
Compile via:
sudo gcc -g example2.c -o example2
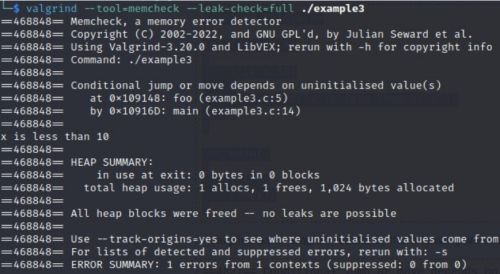
Uninitialized Variable
   #include <stdio.h>
   int fct(int x)
   {
       if(x < 10)
       {
           printf("x is less than 10\n");
       }
   }

   int main()
   {
       int y;
       fct(y);
   }
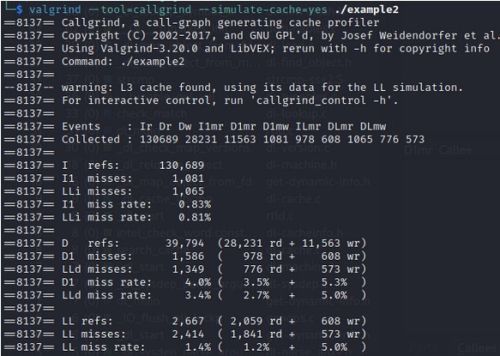
Cachegrind
- a cache profiler
- performs a detailed simulation of the I1, D1 and L2 caches in your CPU and so can accurately pinpoint the sources of cache misses in your code
- it identifies the number of cache misses, memory references and instructions executed for each line of source code, with per-function, per-module and whole-program summaries
- useful with programs written in any language
- runs programs about 20--100x slower than normal.
Callgrind
- An extension to Cachegrind
- offers all the information that Cachegrind offers, plus additional information about Callgraphs
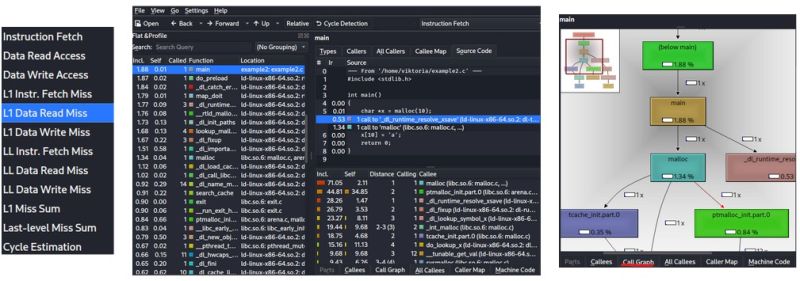
- Separately available is a visualization tool KCachegrind
- gives a better overview of the data collected by Callgrind
- it can also be used to visualize the output of Cachegrind
- simply run Callgrind/Cachegrind to generate the files which you then feed to KCachegrind
To install KCachegrind, simply run:
sudo apt-get install kcachegrind
The files that are generated via Cachegrind/Callgrind look like this:
The interface in KCachegrind allows to inspect
Here you can see the simulations of the I1, D1 and L2 caches in your CPU in a visualized, user-friendly format, to identify cache misses in your code faster.
Massif
- is a heap profiler
- performs detailed heap profiling by taking snapshots of a program's heap on a regular basis
- creates a graph showing heap usage over time, including information about which parts of the program are responsible for the most memory allocations
- the graph is supplemented by a text or HTML file containing more information to determine where most memory is allocated
- runs programs about 20 times slower than normal
Helgrind
- is a thread debugger that detects data races (race conditions vulnerability) in multithreaded programs
- searches for memory locations that are accessed by more than one (POSIX p-)thread but for which no consistently used (pthread_mutex_) lock can be found
- is useful for any program that uses pthreads
DRD
- for detecting errors in multithreaded C and C++ programs
- works for any program that uses the POSIX threading primitives
- uses threading concepts based on the POSIX threading primitives
- requires less memory than Helgrind to perform its analysis for most programs
DHAT
- is a tool to examine how programs use their heap allocations
- keeps track of the allocated blocks and examines each memory access to find out which block it refers to
Why use Valgrind?
- Automatic detection of memory management and threading errors
- Performance improvement
- Debugging and profiling system for large, complex programs
- Software domains:
- Desktop applications
- Libraries
- Databases
- Games
- ...
- Works with programs written in any language
When to use Valgrind?
- Automatic Testing
- After major code changes
- When errors occur
- When bugs are suspected
- Before a release
When NOT to use Valgrind - what can it NOT find?
- Valgrind checks programs dynamically during execution
- Does not report errors if no runtime error occurs for certain input values (even if the program contains errors)
- Faulty memory accesses or memory leaks
- No bounds checking on static arrays (allocated on the stack)
- No static stack/buffer/integer overflows/underflows
- if you declare an array in a method, Valgrind does not warn about it
