Difference between revisions of "Wireshark"
| Line 72: | Line 72: | ||
Below the packet details, is the packet shown in Bytes. Mostly not very human friendly to read. To change that, the configuration and other tips are shown in the next paragraph. | Below the packet details, is the packet shown in Bytes. Mostly not very human friendly to read. To change that, the configuration and other tips are shown in the next paragraph. | ||
=== Not so well known Features === | |||
Here are some configurations listed to make Wireshark easier and clearer to read. | |||
* '''Wide Screen''' - The default view of Wireshark is not adjusted for wide screen. To make a better use of the whole screen change the following. In the menu Edit/Preferences/Appearance/Layout use the fourth Pane order. For the third pane choose Packet Diagram, instead of Packet Bytes. The result is shown in figure 'Full Screen'. In the Packet Diagram, you can click on any field and the corresponding value is shown in the Packet Details. | |||
* '''Time''' - By default the Time in the Packet List is set to seconds since the capture started. To make it easier to find specific packages, under View/Display Time Format, you can change it to Time of Day. | |||
* '''Name Resolution''' - Also by default, DNS is not activated. Under View/Name Resoultion you can activate name resolution for phyiscal, network and transport addresses. The name resolution is the only active action, which is performed by Wireshark in an observed network. | |||
* '''Open Connections''' - In the Statistics menu, under Conversations, you can see all open connections at once. Separated in the different Layers: Data Link (Ethernet), Network (IP) and Transport (TCP/UDP). | |||
* '''ACL Rule Creation''' - In the Tools menu, under Firewall ACL Rules, you can create different ACL Rules. Dependent of the selected packet in the Packet List, it shows a combination of outbound/inbound allow/deny rules. And also for different systems like Cisco IOS, IP Filter, IP Tables and Windows Firewall. | |||
* '''Credentials''' - Also in the Tools menu, under Credentials, Wireshark shows all credentials, which could be read automatically, and in which packet they were sent. This only works with unencrypted traffic, like Open Authentication. | |||
== References == | == References == | ||
Revision as of 15:03, 15 January 2021
Summary
Wireshark is one of the most famous network protocol analyzers. It is a powerful multi platform open source tool, that can analyze network traffic on all possible network interfaces, like Ethernet, Wi-Fi, Bluetooth, local Loopback and VMware Adapters and even USB. The Wireshark project was founded 1998 by Gerald Combs, under the name of 'Ethernal' and gets continuously further developed by volunteers, network professionals and enthusiasts around the globe. Version 1.0 was released in 2008. Before, only expensive and proprietary solutions were available. Today Wireshark provides a wide set of features including:
- Capturing network traffic
- Filter and visualise the traffic
- Safe and open captured traffic in files
- Import and export other capture file formats
Therefore Wireshark is used to troubleshoot network problems, examine network security, test network applications and for educational purposes.
The application is free to download from the Wireshark website and is published under the GNU General Public License. A wizard leads trough the installation process. Npcap has to be installed to capture network traffic, additionally USBpcap can be installed, to capture USB traffic. Npcap is a packet sniffing driver copyrighted by the Nmap Project.
Functionality
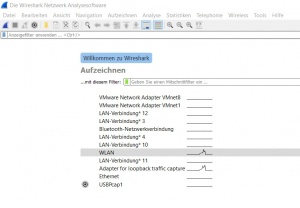
After starting the Wireshark application, it automatically scans for all available interfaces. In Figure 'Start screen' you can see the listed interfaces with a preview of the network traffic.
By clicking on 'Aufzeichnen' or 'Capture' above the interface list, the interface menu opens. The first tab shows the interfaces including their MAC Addresses, which helps identifying the right one. Also Pipes and remote interfaces can be configured. The second tab shows the output options. Here you can save the captures automatically in files, according to different rules. The third tab offers additional options for display and name resolution.
Capture and Display Filter
The capture process starts by double clicking a interface or select one and click on the blue fin icon in the menu bar.
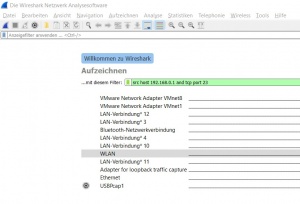
The Capture Filter is set before starting a packet capture and cannot be modified during the capture. It is more limited than the display filter and used to reduce the size of raw capture data. The filter can be entered in the text-field above the interfaces before the capturing is started. The Capture Filter has an own syntax described below. It only supports combinations of the listed primitives. An example is shown in figure 'Capture Filter'. The filter captures only packets which source IP address is 192.168.0.1 and the TCP port 23
Protocol selection  [tcp|udp]
IP address          [src|dst] [host]
Port number         [port]
Operations          [and|or] [less|greater] [not]
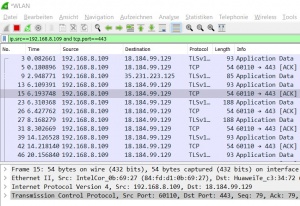
The Display Filter only filters the output on the screen. But can be modified during the capture process and also when analysing a saved capturing. So it's more flexible and can be adjusted to current needs. It's entered during a capturing in the above text field as shown in figure 'Display Filter'.
The Display Filter has a different syntax than the Capture Filter. Probably, because Wireshark is developed by many different developers, who add single features. The filter displays only packets which source IP address is 192.168.8.109 and the TCP port 443. As shown below, the Display Filter offers more possibilities to filter packets.
MAC address         [eth]
L3 Protocol         [ip|ipv6]
L4 Protocol         [tcp|udp]
IP address          [src|dst] [host]
Port number         [port]
Operations          [and|or|xor] []not|in]
Comparison Operator [==|!=|<|<=|>=|>]
Slices              [x:y]
Function            [upper|lower|len|count|string]
A more detailed list with possible filter expressions can be found in the Wireshark User Guide.
Analyze
During the capture, a list of all incoming packets is displayed, as seen in figure 'Packet List'. The columns are described as follows:
- No. stands for the packet number, which Wireshark starts at zero, to make it more readable.
- Time shows the seconds since the capture started.
- Source is the packet source IP- or MAC-address.
- Destination is the packet destination IP- or MAC-address.
- Protocol stands for the used transport protocol.
- Length is the packet length in Bytes.
- Info shows the packet information, which Wireshark extracts automatically.
In the packet details, shown in figure 'Packet Details', you can see all headers from the different OSI Layers. In this example the TLS Application Data is encrypted and unreadable. From the TCP header you can read the source and destination port, sequence and ACK numbers, set flags, the size and the checksum. From the IP header you can read the version, length, flags, the TTL, the encapsulated protocol (TCP), checksum and source and destination IP address. From the Ethernet Header you can read the source and destination MAC address, the frame number and lengtha and the encapsualted protocols.
Below the packet details, is the packet shown in Bytes. Mostly not very human friendly to read. To change that, the configuration and other tips are shown in the next paragraph.
Not so well known Features
Here are some configurations listed to make Wireshark easier and clearer to read.
- Wide Screen - The default view of Wireshark is not adjusted for wide screen. To make a better use of the whole screen change the following. In the menu Edit/Preferences/Appearance/Layout use the fourth Pane order. For the third pane choose Packet Diagram, instead of Packet Bytes. The result is shown in figure 'Full Screen'. In the Packet Diagram, you can click on any field and the corresponding value is shown in the Packet Details.
- Time - By default the Time in the Packet List is set to seconds since the capture started. To make it easier to find specific packages, under View/Display Time Format, you can change it to Time of Day.
- Name Resolution - Also by default, DNS is not activated. Under View/Name Resoultion you can activate name resolution for phyiscal, network and transport addresses. The name resolution is the only active action, which is performed by Wireshark in an observed network.
- Open Connections - In the Statistics menu, under Conversations, you can see all open connections at once. Separated in the different Layers: Data Link (Ethernet), Network (IP) and Transport (TCP/UDP).
- ACL Rule Creation - In the Tools menu, under Firewall ACL Rules, you can create different ACL Rules. Dependent of the selected packet in the Packet List, it shows a combination of outbound/inbound allow/deny rules. And also for different systems like Cisco IOS, IP Filter, IP Tables and Windows Firewall.
- Credentials - Also in the Tools menu, under Credentials, Wireshark shows all credentials, which could be read automatically, and in which packet they were sent. This only works with unencrypted traffic, like Open Authentication.
References
- https://www.wireshark.org/
- https://nmap.org/
- https://www.tcpdump.org/
- Comparative study of two most popular packet sniffing tools-Tcpdump and Wireshark - https://ieeexplore.ieee.org/document/8319360/
- Packet tracing and analysis of network cameras with Wireshark - https://ieeexplore.ieee.org/document/7916510/
- Network Traffic Monitoring and Analysis Using Packet Sniffer - https://ieeexplore.ieee.org/document/8742369/


